Business Intelligence coursework for UWS
This Academic Projects section is from the first version of this site and stays for historical completeness.
To gain academic credits during my time with UWS, as well as passing the MCTS exam I completed a Business Intelligence project as follows...
The requirements for this ran to four pages so the following is heavily edited.
1. Provide an overview of a company or organisation that conducts much or all of its business through a website.
This overview should provide sufficient information to understand what type of company/organisation you are investigating, the nature of their business and the size and complexity of the company/organisation and the extent to which they use their website to support their business/activities.
2. Identify and describe the part of the organisation that you are going to focus on and the associated business processes.
You should learn as much as possible about the website and the company/organisation that is supported. In particular you should investigate how the website interacts with the customer/member and how it captures data that may prove valuable to the company/organisation as a source of business intelligence.
3. Create a bus matrix and example queries to establish analytical requirements for the company/organisation.
Consider how the business processes available through your website are likely to be analysed in such a way as to provide useful business intelligence for your company/organisation.
4. Design a data mart that can support the analytical requirements for a single business process.
Select a single business process to use in this part of the coursework. Using only the data associated with this business process, you are required to design a data mart that can support the analysis of the selected business process.
5. Implement a data mart using Microsoft SQL server that can support the analytical requirements for a single business process.
The data mart should also include a range of analytical queries that provide business intelligence for the Director/Manager (or other identified role) of your company/organisation. The database should contain sufficient test data to allow for testing of any T-SQL scripts.
I chose to consider how a company like CNET Downloads that profits largely through advertising might use BI to analyse and improve company performance. If you're really interested you can download my submission here [docx 900kb] but for now I'll focus on the dev highlights...
They will undoubtedly have extensive demographic data on their visitors and be particularly interested in who downloads what, what adverts they click on, what reviews they read, etc. Though not a coursework requirement, I built an OLTP database that would capture these types of transactions and for practical purposes included session data within this. (image)
I used Visual Studio 2010 Ultimate to generate test data centred on 2000 rows in the Event table and then used SQL Server 2008 BIDS Integration Services (SSIS) to do an ETL into the data mart. (image)
From a coding perspective, the point of this coursework wasn't to build an actual OLAP cube from the warehouse, but to gain some experience with the OLAP extensions to SQL - ROLLUP, CUBE, etc. There are examples of each in the Word document linked to above, for this summary I'll provide one:
DECLARE @RegType VARCHAR(200)
SELECT @RegType =
STUFF((SELECT DISTINCT '],[' + [Registration Type] FROM [Dim Visitor]
FOR XML PATH('')),1,2,'') + ']'
DECLARE @AppCategory VARCHAR(200)
SELECT @AppCategory =
STUFF((SELECT DISTINCT ''',''' + [App Category] FROM [Dim Application]
FOR XML PATH('')),1,2,'') + ''''
DECLARE @query VARCHAR(500)
SET @query =
'SELECT * FROM
(SELECT a.[App Category],
v.[Registration Type] AS RegType,
f.DownloadID AS DownloadID
FROM [Fact Session Event] f, [Dim Visitor] v, [Dim Application] a
WHERE f.VisitorID=v.VisitorID
AND f.AppID=a.AppID
AND f.DownloadID>1 AND [App Category] IN (' +@AppCategory+ ')) AS src
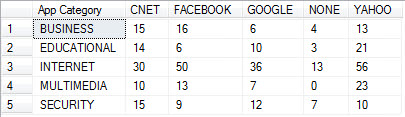
PIVOT(COUNT(DownloadID) FOR RegType IN ('+@RegType+ ')) AS pvt'
EXEC (@query)
Which very neatly shows downloads against one demographic metric: